The diversity index is based on diversity concepts from ecology, where it is used to estimate the diversity of plant and animal life. You can think of the diversity index as a way to perform a weighted count of species. If you would like to compare the species diversity in different habitats, there are several ways of doing that:
- You can count the number of different species present (but sensitive to ‘single’ animals that are just ‘visiting’ a habitat)
- You can use the number of animals of which there are at least an x number (but difficult to determine x, e.g., 5 elephants is deemed more important for diversity than 5 ants)
- Use a weighted average whereby animals are given more importance if there is many of them (that is the one we’re using!)
Diversity measures 101
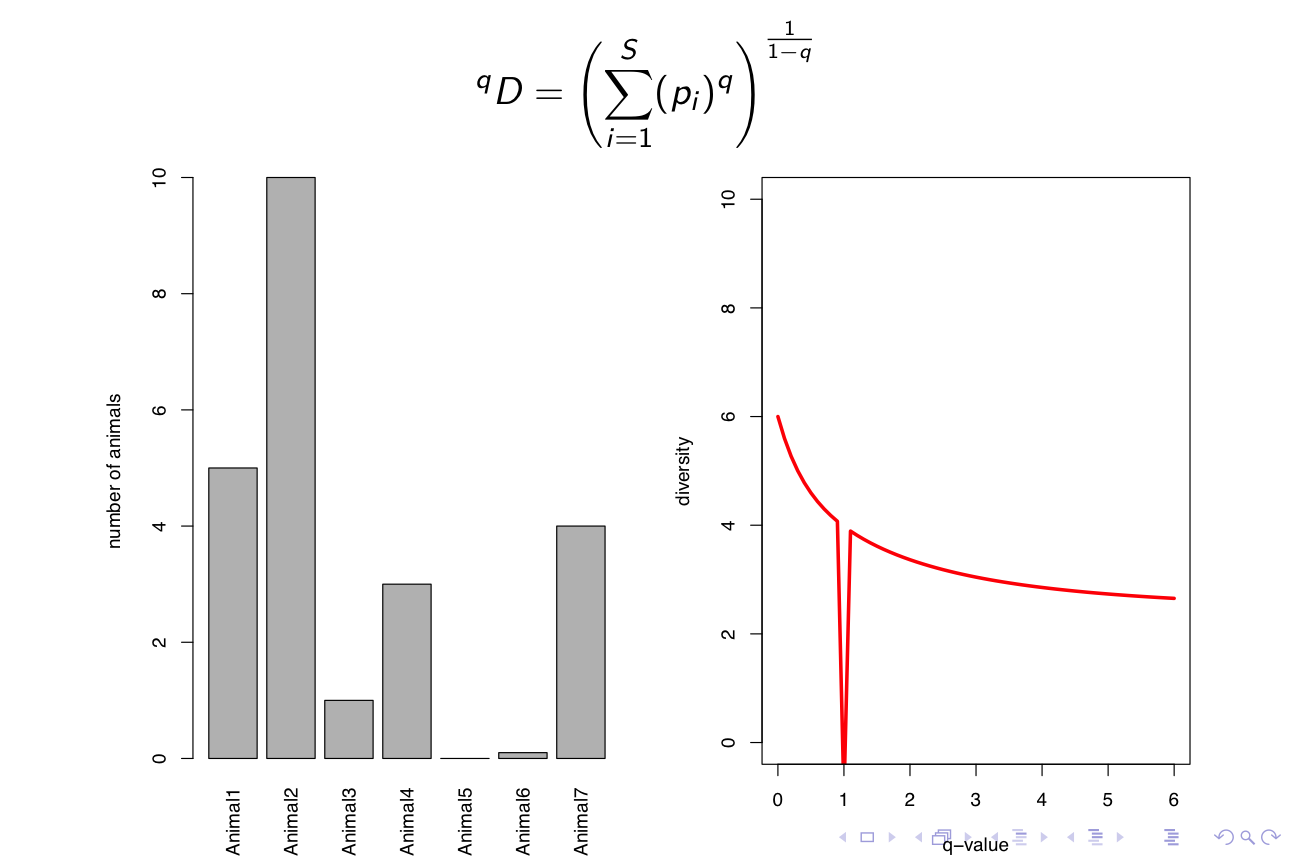
There are many different diversity measures. Each of them has a different range and all their values have different interpretations. To make life easy, these values can be represented as the number of responses of equal magnitude so as to provide an intuitive measure that everyone may understand. So a diversity of 5 means: a diversity comparable to having 5 equally abundant species.
In a highly cited (and highly recommended!) paper, L. Jost, Oikos 2006) shows that many diversity measures map onto one another if you introduce a weighting factor that tunes the relative contribution of high- and low-abundant species to the final estimate of diversity. The final form of diversity equation looks scary, but is quite easy to understand.

where $D$ is the diversity measure of order $q$, $S$ is the number of species, and $p_i$ the proportion of animals from a specific species, expressed as a fraction. Depending on how you weigh high-abundant vs low-abundant species (that would be parameter $q$), you obtain a different estimate of diversity.
The interpretation of this index is diversity equivalent to that number of equally abundent species. For instance, a diversity of 3 means: 3 equally abundent species.
Adaptation to antibody measurements
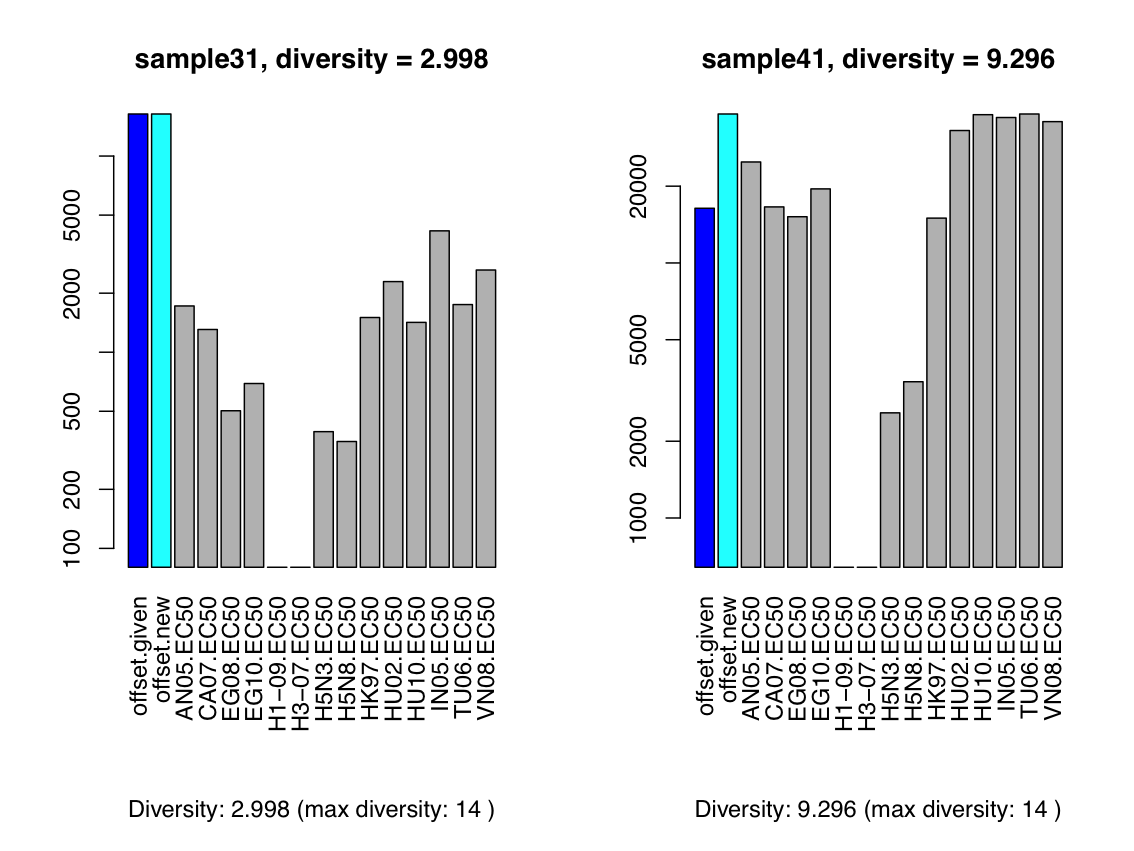
The index is adapted to be used for evaluating antibody measurements, i.e., fluorescence. To quantify diversity of responses, this index can be used. However, to down-weigh the influence of unprotective responses (i.e., those with a low fluorescence value), we include a parameter that sets the minimal level of what is considered an effective response: an offset or anchor value to distinguish between background and real responses.
The anchor value is taken along when the fractions of species are calculated. Please note that the anchor is not a cutoff, because the values below it are given less weight - but still taken into account.

See our paper in Scientific Reports for more details. Supplementary material S3 contains the full derivation of the adapted index.